Plotting#
This notebook covers the basics of plotting in Python with matplotlib.
# matplotlib package has the plotting functionality of MATLAB
import matplotlib.pyplot as plt
# plt.plot generates a line on the graph from a list of
# x-coordinates and a list of y-coordinates.
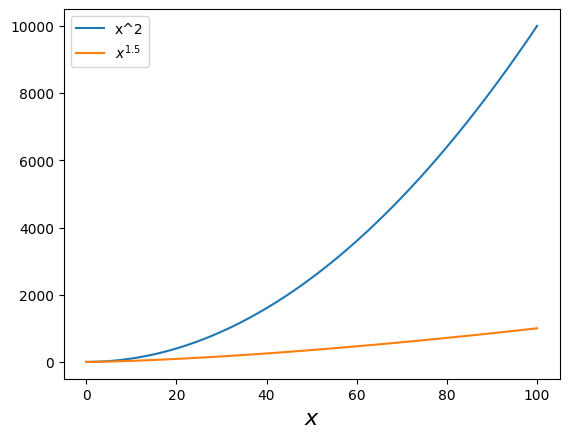
x = range(101)
y1 = [xi**2 for xi in x]
# Use labels to name lines in the graph.
plt.plot(x, y1, label="x^2")
# Call plt.plot multiple times to plot multiple lines.
y2 = [xi**1.5 for xi in x]
# Labels can be latex code.
plt.plot(x, y2, label=r"$x^{1.5}$")
# plt.xlabel and plt.ylabel assign names to the axes.
plt.xlabel(r"$x$", fontsize=16)
# plt.legend adds a legend to the graph with the line labels.
plt.legend(loc="upper left")
# plt.show displays the graph.
plt.show()